
From Jonathan Bayes, consultant Chief Investment Officer, Bentleys Wealth Advisors
Market update
Forgive me, but I am going to include several graphics in this week’s summary as a means to best articulate several points.
Last week saw market’s rebound modestly and continue the June gains, this despite disappointing domestic unemployment figures and the rapidly rising infection rates across much of the southern USA.
Sentiment indicators have rebounded from the deep caution witnessed during late March, and institutional investors surveyed by Bank of America have reduced cash levels and increased equity exposures reasonably significantly over the last month.
Markets continue to cheer for the rapid monthly improvement in May and June economic data, conveniently forgetting the hugely diminished base upon which the gains are being made.
In almost all incidences, activity across the U.S and Australia remains anywhere from -10% to -30% on an annualised basis, with exceptional pockets in online spending obviously, and in retail categories associated with lessened social mobility such as homewares, home-furnishing, DIY and home-office activities.
At present the economy and financial markets appear anaesthetised from the dire employment situation by government cash-handouts, but there is a finite time and cost on these programs that only a mass-produced vaccine can alleviate.
Over the April and May months, almost 1m Australian’s lost their jobs and right now the total number of unemployed and ‘under’ employed workers in Australia comprises 13% of the workforce.
In the United States this number is 20%.
Whilst like everybody I wish for a rapid return to economic and social normality, continued infection outbreaks are likely to restrict social mobility, and with that domestic demand.
More people are employed in retail stores and in the service sectors than in online businesses which is why we need the population circulating in order to have domestic demand return to normal.
The threat of structurally higher unemployment in the coming 18 months is extremely likely and when the government support packages wind down will be a heavy millstone around the neck of the global economy.
This brings me to the next point, which is the importance of underlying earnings to the share-market.
In recent months, many commentators have been quick to point out that the ‘share-market isn’t the economy’, highlighting why it is entirely reasonable to have seen the biggest 50-day rally in history occur during one of the most, if not the most, significant demand contractions in a century.
And they are right in the near term.
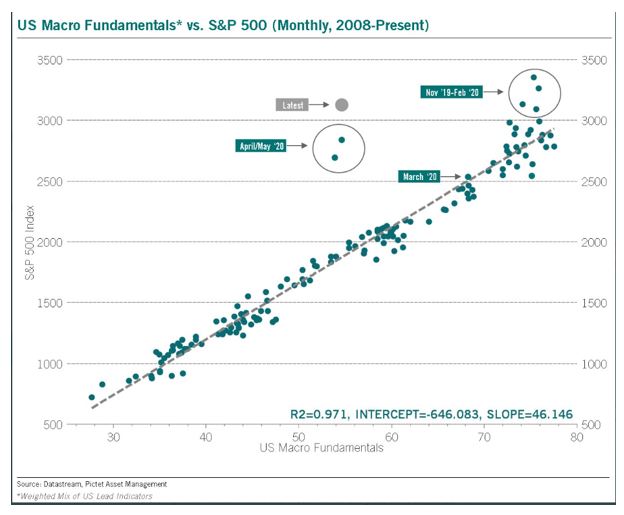
But as the chart below shows, the economy does have a significant bearing on share-prices over the medium to long-term because it influences corporate earnings, and corporate earnings are crucial in their influence over share markets.
From the dataset constructed by Pictet below, you can see not only how significant the current outlier is relative to the past 10 years, but just how significantly overvalued share-markets have been relative to the economy since the GFC during the last 6 months.
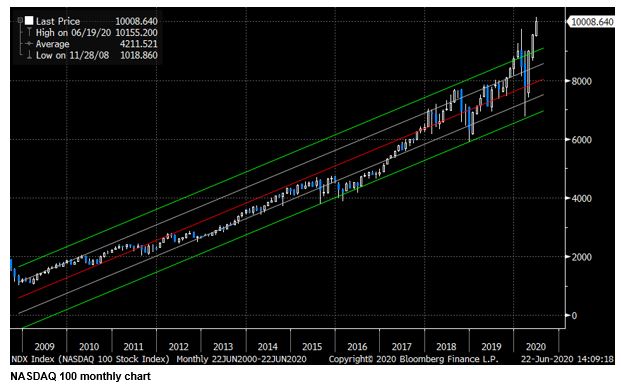
The chart below further highlights this point.
The chart below is a monthly price chart for the NASDAQ 100 that extends back to the GFC.
The red and green lines chart the powerful trend, with the red line the mean and the green line channels reflecting the first and second standard deviations above the trend average.
As you can see, the current NASDAQ 100 level north of 10,000 is actually now knocking on a level of 4 standard deviations above the mean for what has been one of the strongest rallies in history.
For context, 4 standard deviations is effectively a 1 in 1000 event.
We are very extreme here.
We have reminded readers in recent months that the fantastic equity market rally has taken equity valuations both here and in the United States back to their highest levels in 20 years.
It doesn’t feel inappropriate to say that share-markets are extremely expectant of good news.
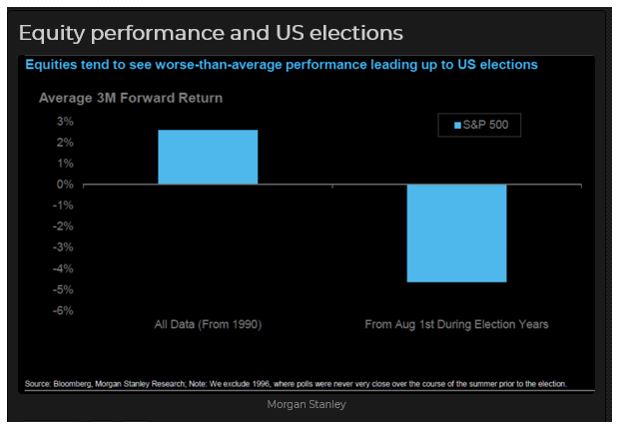
Trouble is, the coming few months are likely to face more hurdles, not least of which will be the Presidential Election in early November.
Unfortunately, work done by Morgan Stanley, as the chart below demonstrates, suggests that historically U.S equity markets underperform, presumably due to uncertainty, in the lead up to the election.
Typically, the S&P500 has lost almost -5% in the months leading into an election.
This election cycle it doesn’t help that the Democrat contender has now jumped well ahead in the electoral betting and carries with him a policy platform that would see a rise in both capital gains and corporate tax rates and the implementation of a US$15/hour living wage.
And all of this is before we bother to address the risks of a ‘second-wave’ of COVID-19 infections, both here and in the United States.
For now, we think investors would do well to ignore the month by month economic data volatility and to keep an eye on real-world indicators such as those we have suggested on mobility from each of Apple and Google, and on weekly indicators of spending that come from private companies such as Tyro etc.
We remain cautious and think that patience will allow markets to come to us during our Winter and that we will get opportunities to use cash at levels offering significantly better risk/reward outcomes than available currently.
Looking ahead
| Monday | US Chicago Fed National Activity (MAY) |
| Tuesday | AU CBA PMI Services/Manufacturing (JUN), AU ANZ Weekly Confidence, US Markit PMI Services/Manufacturing (JUN), Richmond Fed Manufacturing (JUN) |
| Wednesday | AU Skilled Vacancies (MAY) |
| Thursday | AU Job Vacancies (MAY), US Weekly Jobless Claims, US Weekly Bloomberg Consumer Confidence |
| Friday | US PCE (MAY), US Michigan Consumer Confidence (JUN) |
This week and next are the likely calm before the storm since July will see an escalation in June quarter corporate reporting and the end of the U.S Paycheck Protection Program and its $600/week additional unemployment benefit.
July and August will also likely see further news on government stimulus which could go either way – in the U.S its highly likely we will see additional stimulus announced, whether it be in the form of infrastructure spending or an extension to the PPP benefits as above.
In Australia on July 23rd the Federal Government will hold a belated mid-year economic and financial outlook statement and at this point we are likely to learn of plans for continuing, modifying or extending Jobkeeper.
Friday 5pm values
| Index | Change | % | |
| All Ordinaries | 6061 | +101 | +1.7% |
| S&P / ASX 200 | 5942 | +95 | +1.7% |
| Property Trust Index | 1276 | +23 | +2.0% |
| Utilities Index | 7788 | +75 | +1.0% |
| Financials Index | 4843 | +99 | +2.07% |
| Materials Index | 13012 | -220 | -1.7% |
Friday closing values
| Index | Change | % | |
| U.S. S&P 500 | 3097 | +56 | +1.9% |
| London’s FTSE | 6292 | +187 | +3.0% |
| Japan’s Nikkei | 22478 | +173 | +0.7% |
| Hang Seng | 24643 | +342 | +1.4% |
| China’s Shanghai | 2967 | +48 | +1.6% |
Key dividends
| Date | |
| Mon 22 June | Div Ex-Date – Harvey Norman (HVN)
Div Pay-Date – ANZPG, ANZPH, NABPE, WBCPF, WBCPH |
| Tue 23 June | Div Pay-Date – WBCPE |
| Wed 24 June | Div Ex-Date – Scentre (SCG) |
| Thu 25 June | Div Pay-Date – Ausnet (AST) |
| Fri 26 June | Div Ex-Date – NABPD |
–
Tuesday 23 June 2020, 5pm
For more information on the above please contact Bentleys Wealth Advisors directly or on +61 2 9220 0700.
This information is general in nature and is provided by Bentleys Wealth Advisors. It does not take into account the objectives, financial situation or needs of any particular person. You need to consider your financial situation and needs before making any decision based on this information.