
From Jonathan Bayes, consultant Chief Investment Officer, Bentleys Wealth Advisors
Coronavirus Investment update
Mixed emotions on the week we have just seen.
In Australia, the early efforts to quarantine and our fortunately low population density seem to have helped ensure our ‘infection curve’ remains flatter than other countries.
Unfortunately it is our expectation that global investment markets will continue to take their cue from the United States where quite the opposite has occurred and where the man tasked with fighting the virus there, Dr Anthony Fauci, remarked on Sunday night that it was plausible to see upwards of 100,000 deaths in the country if they didn’t further extend and tighten current quarantine restrictions.
The President seems to be finally understanding the gravity of the situation by suggesting social distancing measures currently in place now extend until ‘at least April 30th’, but that he expected the country to be back on its feet by June 1st, not Easter as he had previously hoped.
Right now it is all random speculation on his behalf, and for that reason it is very difficult for markets to gain any confidence as to a likely end to quarantine measures and to a resumption of economic and societal normality.
Because of this uncertainty we are withholding the significant portfolio firepower we have to utilise and will only feel more confident in applying it once we believe there to be a credible line of sight towards an end to this horrible pandemic.
On an encouraging note, we do believe there is increasing value apparent in the Australian equity market in particular.
The ASX200 is now back within 10% of the low valuation point it reached during the GFC if you were to use long-term average corporate earnings, and we think this a robust and credible manner with which to assess long term structural value.
You will see amongst the charts below we have included one that demonstrates the ASX200’s valuation on this long-term measure.
We have included 4 charts this week that we find highly relevant for our thinking on portfolios at present.
We hope you find them as useful as we do.
Observations for the past week
Coronavirus confirmed cases spike in the United States
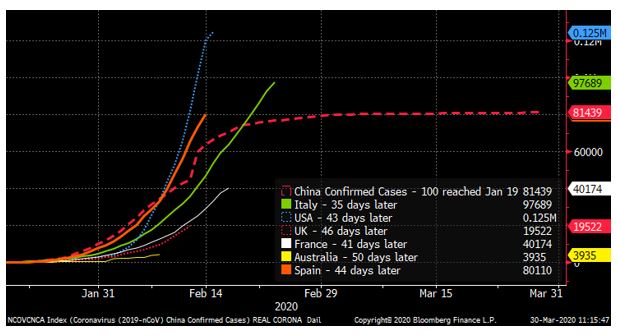
- The chart below demonstrates the rate of infection in several major countries, but notably highlights in blue the losing battle being faced in the United States, where case numbers are rising exponentially
- The chart uses the Chinese data as a base and plots each countries growth from 100 ‘confirmed cases’. China reached 100 cases on January 19th and so all other countries have been rebased to that date from when each country individually reached 100 cases.
- As you can see, the United States rate of infection has well surpassed not only China, but Italy and Spain also, and given still very lax quarantine and testing regimes relative to other countries, the concern is that this number could blowout above 1+ million in the coming month
- The good news is that Australia’s curve (in yellow) continues to progress at a flatter rate than all of its peers above, which augers well for the local health system in the coming month
ASX200 valuation becoming more compelling
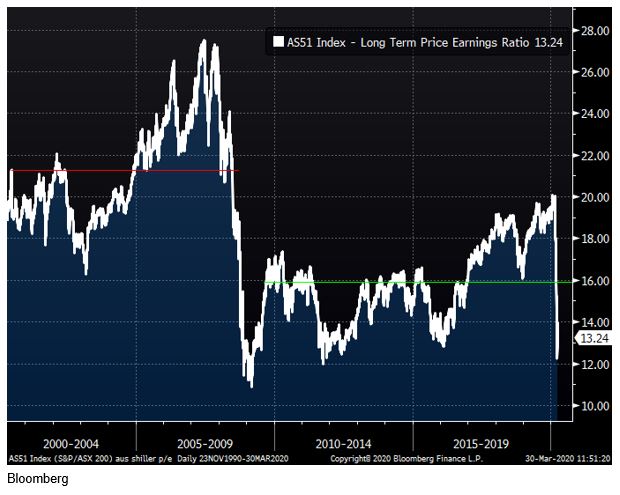
- The chart below highlights the current ASX200 valuation using long-term (average 10-year) earnings per share
- As you can see, the current market valuation of 13.2x long-term earnings is only 10% above the trough of 11.8x seen during the GFC
- We would caution to highlight that Australia did manage to duck a recession during 2008 and that this would be unlikely this time around, particularly given the significant employment impact COVID-19 will have on Australia’s economy
- However, we are looking more favourably at the local market in light of the pullback as discussed above
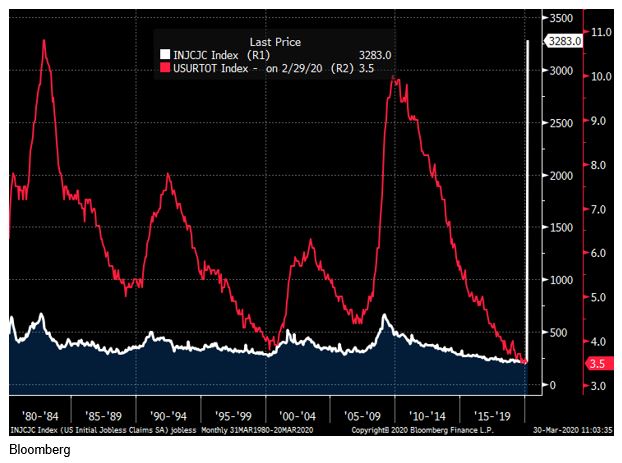
US Weekly Jobless Claims jump to record – 5x previous peak
- New welfare claimants in the U.S jumped to 3.3m eclipsing the previous record jumps of ~700,000 seen in the early days of the GFC and also during the 1980’s recession
- These numbers will escalate further in the coming weeks as quarantine measures across the U.S are tightened and extended – Trump saying Sunday quarantine requests would last until at least April 30th
- The chart below shows in white the weekly jobless claim figures and in red it is overlaid with the U.S unemployment rate which looks clearly likely to spike to well over 10% during this crisis
- Note that the 3.3m jump last week represents 2% of the entire U.S labour force
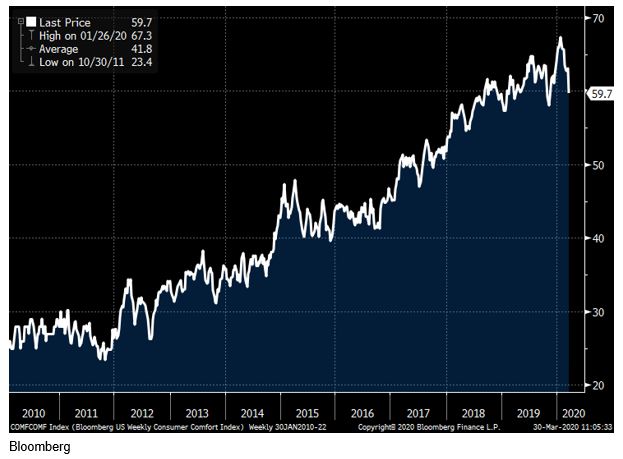
US Weekly Consumer Confidence
- The chart below highlights weekly consumer confidence in the U.S and demonstrates that although it has come off its highs, consumers still feel largely unthreatened by the coronavirus impact
- We believe that in the coming weeks the sad reality of the situation will be brought to bear on the US economy and US consumers
- As a contrast, Australian weekly consumer confidence polled by the ANZ dived to its lowest on record last week as quarantine measures took hold here locally.
Looking ahead
| Monday | n/a |
| Tuesday | AU ANZ Weekly Consumer Confidence, AU Private Sector Credit (Feb), US MNI Chicago PMI (Mar), US Consumer Confidence (Mar) |
| Wednesday | AU AIG Manufacturing Survey (Mar), CBA Manufacturing Survey (Mar), AU Building Approvals (Feb), AU RBA Meeting minutes, US Markit Manufacturing PMI (Mar), US ISM (Mar), US Challenger Job Cuts (Mar), US ADP Employment (Mar) |
| Thursday | AU Job Vacancies (Feb), US Weekly Jobless Claims, US Weekly Bloomberg Consumer Confidence |
| Friday | AU AIG Construction Survey (Mar), CBA Services Survey (Mar), US ISM Services PMI (Mar), US Markit Services PMI (Mar), US Employment (Mar) |
Friday 5pm values
| Index | Change | % | |
| All Ordinaries | 4874 | +20 | +0.4% |
| S&P / ASX 200 | 4842 | +26 | +0.5% |
| Property Trust Index | 988 | -29 | -0.3% |
| Utilities Index | 6918 | -93 | -1.3% |
| Financials Index | 3936 | -139 | -3.5% |
| Materials Index | 10517 | +405 | +4% |
Friday closing values
| Index | Change | % | |
| U.S. S&P 500 | 2541 | +237 | +10% |
| London’s FTSE | 5510 | +320 | +6.2% |
| Japan’s Nikkei | 19389 | +2837 | +17% |
| Hang Seng | 23484 | +689 | +3% |
| China’s Shanghai | 2772 | +27 | +1% |
Key dividends
| Date | |
| Mon 30 March | Div Ex-Date – Qualitas Real Income (QRI)
Div Pay Date –WBCPG |
| Tue 31 March | Div Ex-Date – Metrics (MXT/MOT)
Div Pay Date – Commonwealth Bank (CBA) |
| Wed 1 April | n/a |
| Thu 2 April | n/a |
| Fri 3 April | Div Pay Date – Caltex (CTX), Crown Resorts (CWN), Treasury Wine (TWE) |
–
Monday 30 March 2020, 4pm
For more information on the above please contact Bentleys Wealth Advisors directly or on +61 2 9220 0700.
This information is general in nature and is provided by Bentleys Wealth Advisors. It does not take into account the objectives, financial situation or needs of any particular person. You need to consider your financial situation and needs before making any decisions based on this information.