From Jonathan Bayes, consultant Chief Investment Officer, Bentleys Wealth Advisors
Market update
The grind continues in spite of record levels of virus infections in the United States and globally, but also in spite of more evidence to suggest a peaking in ‘recovery momentum’.
We have addressed this below in some charts that we think will be worthy of consideration.
The coming 8 weeks will be extremely important in determining the future direction for equity markets after what has been some incredible volatility in the 1H of 2020.
We have highlighted below the start of corporate reporting season due next week, but also the likelihood for statements relating to fiscal stimulus measures and the potential for their extension both here and in the United States during July also.
The key date that investors will continue to eye is the school term restart in the United States on the 3rd of September, particularly given the scourge of infection currently underway across the United States.
If hospitalisations increase as they seem to be, and then mortality statistics follow suit as they likely will in the coming fortnight, there will be a major focus of authorities and businesses alike on the health priorities for the country leading into the autumn.
We think it absolutely vital for any sustained economic recovery that the United States focus on getting the virus under control such that the school term can restart on time.
The highlights from last week revolve around the U.S employment figures and the headline return of 4.8m Americans to work.
Whilst encouraging, the figures ignore the fact there remains almost 15m Americans who have still as yet not returned to previous employment since the COVID-19 outbreak, a whopping 9% of the labour force.
In Australia the most interesting release was the May Building Approvals figure which was the lowest absolute number in 6 years, with apartment approvals the lowest in over a decade.
On a positive note, Chinese service sector activity has definitely been the one bright spot from a global economic perspective with the June activity index posting an excellent rebound on May.
Having contained the virus early, the Chinese economy is arguably doing as well as any developed nation in regaining the levels of economic activity seen pre COVID-19.
Across portfolios, we remain minded to be cautious in general and feel like the risks to market levels are only rising as we get closer to the U.S autumn and the November 3rd Presidential Election.
U.S recovery taking a brief pause in recent weeks
With so much focus on the ability of the global economy to recover from the enormous loss of demand inflicted upon it by quarantine measures associated with COVID-19, we have kept a very close eye on high frequency data points both here and abroad that give a good sense for demand on a weekly, and sometimes daily basis.
There are several data suppliers we would happily recommend including:
- unacast.com/covid19/covid-19-retail-impact-scoreboard#scoreboard
- tracktherecovery.org
- alphabeta.com/illiontracking
- libertystreeteconomics.newyorkfed.org/2020/03/monitoring-real-activity-in-real-time-the-weekly-economic-index
Whilst the various measures target different gauges for consumer and business trends, they all agree that having seen a strong bounce off the late March lows, that the consumer rebound has lost traction in recent weeks, particularly in the United States where many of the sunbelt states have been forced to back-track on re-opening plans.
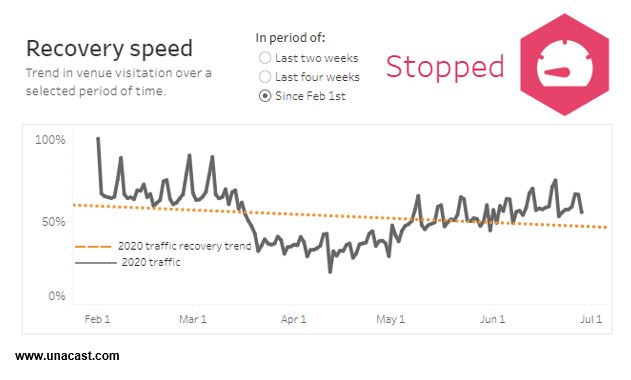
The graphic below is from Unacast and gives a real time indicator of consumer traffic across major retail industries.
As you can see, it indicates the upward momentum has peaked during June.
Unacast comment that as at the 28 June they see foot-traffic across ‘all industries’ down -8% on 2019.
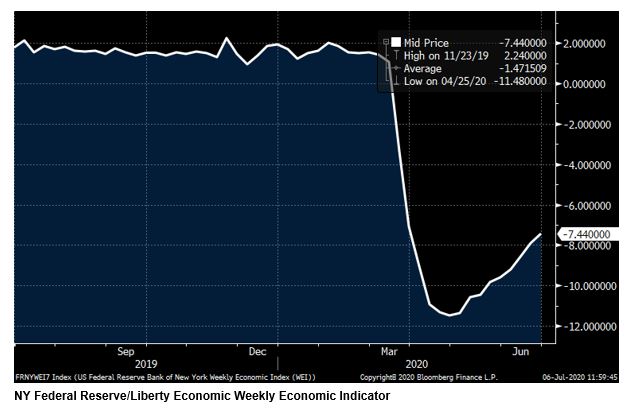
The following graphic seems to correspond well with the Unacast conclusion of a ‘high-single digit’ fall off in consumer patterns.
It is a chart for the New York Federal Reserve Weekly Economic Index, which is an index created by taking high frequency data on retail sales, job classifieds, gasoline demand, consumer confidence, unemployment claims, electricity consumption and steel production and creating an indicator of economic growth.
The chart shows the economy contracting at a rate of -7.44% per annum having lost near -12% in activity at the worst point in late March.
This is really significant since it shows that though recovering, the US economy still has significant ground to recapture relative to pre COVID-19 levels of demand and perhaps demonstrates why investors should be wary of using the word recovery, which implies reclaiming levels seen before the virus, and instead using the term rebound.
Looking ahead
| Monday | AU ANZ Job Advertisements (JUNE), US Markit Services PMI (JUNE), US ISM Non-Manufacturing (JUNE) |
| Tuesday | AU ANZ Weekly Confidence, AU Australian Industry Group Services PMI (JUNE), AU RBA Meeting, US JOLTS Job Openings (MAY), CH Foreign Reserves (JUNE) |
| Wednesday | AU |
| Thursday | AU Home Loans (MAY), US Weekly Jobless Claims, US Weekly Consumer Confidence |
| Friday |
The coming 8 weeks will be extremely eventful and likely shape trends for the rest of 2020.
Corporate reporting season kicks off in the US in a large way next week with the first of the major technology names, Netflix (NFLX) and Microsoft (MSFT).
Beyond the wealth of corporate reporting, we should expect to learn news on the second major stimulus package from the United States that will extend the current CARES package targeted at those impacted by COVD-19 and in Australia we will also learn of the Federal Government’s intentions for further stimulus and the evolution of the current Job-keeper package set to expire at the end of September.
Beyond these important factors, sentiment will also likely be impacted on decisions made in relation to major US sporting seasons and their ability to continue, notably the restarting of basketball (NBA) in late July, the NFL season kick-off due mid-August, but also the commencement date for the new school year in the United States on the 3rd of September.
Any suggestion of a delay to school re-commencement would be seen as a MAJOR negative.
Friday 5pm values
| Index | Change | % | |
| All Ordinaries | 6163 | +152 | +2.5% |
| S&P / ASX 200 | 6058 | +154 | +2.6% |
| Property Trust Index | 1265 | +14 | +1.1% |
| Utilities Index | 7797 | +94 | +1.2% |
| Financials Index | 4935 | +117 | +1.3% |
| Materials Index | 13501 | +223 | +1.6% |
Friday Closing Values
| Index | Change | % | |
| U.S. S&P 500 | 3130 | +121 | +3.9% |
| London’s FTSE | 6157 | -2 | – |
| Japan’s Nikkei | 22306 | -206 | -0.9% |
| Hang Seng | 25373 | +824 | +3.3% |
| China’s Shanghai | 3152 | +173 | +5.7% |
Key dividends
| Date | |
| Mon 6 July | n/a |
| Tue 7 July | Div Pay-Date – NABPD |
| Wed 8 July | Div Pay-Date – Metrics (MXT/MOT)
|
| Thu 9 July | n/a |
| Fri 10 July | n/a |
–
Tuesday 7 July 2020, 10am
For more information on the above please contact Bentleys Wealth Advisors directly or on +61 2 9220 0700.
This information is general in nature and is provided by Bentleys Wealth Advisors. It does not take into account the objectives, financial situation or needs of any particular person. You need to consider your financial situation and needs before making any decision based on this information.


